
Get all the data you need about the real estate market in Cebu
SUMMARY
We analyzed apartment rental yields in Cebu, as of 2026, for residential apartment buyers using the raw Cebu dataset provided, then converted the findings into a practical buyer guide for foreign individual investors.
This article is constantly updated, so the numbers should be read as a current Cebu apartment rental yield snapshot for May 2026 rather than a permanent forecast.
The main finding is that Cebu still offers several mid-single-digit net rental yield opportunities, but the best income math is not always in the most prestigious business districts.
Lapu-Lapu Basak / Marigondon shows the highest estimated net yields in the table, with studios at 5.8% net yield and 1-bedroom apartments at 5.7% net yield. The trade-off is thinner tenant depth and weaker resale liquidity than central Cebu City.
Mandaue Subangdaku, Mabolo, Fuente Osmeña / Capitol Site, Banilad, and Talisay / SRP fringe look more balanced for buyers who want rental income without relying only on a low purchase price.
Cebu Business Park and Cebu IT Park / Apas remain strong rental locations, but their purchase prices absorb more of the rent. Cebu Business Park 2-bedroom apartments are estimated at only 3.7% net yield despite monthly rent around ₱110,000.
The safest apartment format for many beginner buyers is usually the 1-bedroom apartment. It costs more than a studio, but it has a wider tenant base than a small studio and a lower total ticket size than most 2-bedroom apartments.
Studios can be efficient in cheaper areas such as Subangdaku, Mabolo, Talamban, and Basak / Marigondon, but the investor must check building quality, access, tenant depth, and competition from similar units.
The weakest yield profile is usually found in premium or lifestyle-led areas where buyers pay for address, views, branding, or comfort. Lahug / Nivel Hills and Cebu Business Park can be good places to live, but they are less efficient for pure rental income.
For a beginner foreign buyer, the practical Cebu strategy is to compare net yield, not headline rent. A unit must have realistic rent, manageable vacancy, good building operations, and resale liquidity, not just an attractive gross yield.
Get fresh and reliable information about the market in Cebu
Don't base significant investment decisions on outdated data. Get updated and accurate information.

Neighborhoods and apartment rental yields in Cebu in 2026
This table compares apartment rental yields in Cebu by neighborhood and apartment size.
For each area, the table shows estimated purchase price, estimated monthly rent, gross rental yield, and net rental yield for studios, 1-bedroom apartments, and 2-bedroom apartments.
Finally, please note you'll find much more detailed data in our real estate pack about Cebu.
| Neighborhood | Studio average purchase price | Studio average monthly rent | Studio gross rental yield | Studio net rental yield | 1-bedroom average purchase price | 1-bedroom average monthly rent | 1-bedroom gross rental yield | 1-bedroom net rental yield | 2-bedroom average purchase price | 2-bedroom average monthly rent | 2-bedroom gross rental yield | 2-bedroom net rental yield |
|---|---|---|---|---|---|---|---|---|---|---|---|---|
| Banilad | ₱3.8m | ₱22,000 | 6.9% | 5.2% | ₱6.1m | ₱35,000 | 6.9% | 5.2% | ₱10.6m | ₱56,000 | 6.3% | 4.6% |
| Cebu Business Park | ₱5.0m | ₱28,500 | 6.8% | 4.8% | ₱12.5m | ₱62,000 | 6.0% | 4.0% | ₱23.0m | ₱110,000 | 5.7% | 3.7% |
| Cebu IT Park / Apas | ₱5.9m | ₱24,000 | 4.9% | 3.1% | ₱9.8m | ₱48,000 | 5.9% | 4.1% | ₱18.8m | ₱90,000 | 5.7% | 3.9% |
| Fuente Osmeña / Capitol Site | ₱3.3m | ₱19,000 | 6.9% | 5.2% | ₱5.6m | ₱31,000 | 6.6% | 4.9% | ₱9.6m | ₱52,000 | 6.5% | 4.8% |
| Guadalupe | ₱3.0m | ₱17,000 | 6.8% | 5.2% | ₱5.2m | ₱28,000 | 6.5% | 4.9% | ₱8.8m | ₱46,000 | 6.3% | 4.7% |
| Kasambagan | ₱4.3m | ₱23,500 | 6.6% | 4.8% | ₱7.9m | ₱42,000 | 6.4% | 4.6% | ₱14.5m | ₱73,000 | 6.0% | 4.2% |
| Lahug / Nivel Hills | ₱4.9m | ₱22,000 | 5.4% | 3.6% | ₱8.2m | ₱33,000 | 4.8% | 3.0% | ₱15.8m | ₱68,000 | 5.2% | 3.4% |
| Lapu-Lapu Basak / Marigondon | ₱2.9m | ₱18,000 | 7.4% | 5.8% | ₱4.9m | ₱30,000 | 7.3% | 5.7% | ₱8.8m | ₱51,000 | 7.0% | 5.4% |
| Mabolo | ₱3.9m | ₱23,000 | 7.1% | 5.4% | ₱6.8m | ₱38,000 | 6.7% | 5.0% | ₱11.8m | ₱65,000 | 6.6% | 4.9% |
| Mactan Newtown / Punta Engaño | ₱5.8m | ₱30,000 | 6.2% | 4.2% | ₱9.5m | ₱55,000 | 6.9% | 4.9% | ₱19.5m | ₱115,000 | 7.1% | 5.1% |
| Mandaue North Reclamation / Mandani Bay | ₱5.6m | ₱28,000 | 6.0% | 4.0% | ₱8.8m | ₱47,000 | 6.4% | 4.4% | ₱17.0m | ₱85,000 | 6.0% | 4.0% |
| Mandaue Subangdaku | ₱3.4m | ₱20,500 | 7.2% | 5.6% | ₱5.8m | ₱33,000 | 6.8% | 5.2% | ₱9.9m | ₱56,000 | 6.8% | 5.2% |
| Ramos / Mango Avenue | ₱3.2m | ₱18,500 | 6.9% | 5.3% | ₱5.5m | ₱30,000 | 6.5% | 4.9% | ₱9.4m | ₱50,000 | 6.4% | 4.8% |
| Talamban | ₱2.8m | ₱16,000 | 6.9% | 5.4% | ₱4.9m | ₱26,000 | 6.4% | 4.9% | ₱8.7m | ₱44,000 | 6.1% | 4.6% |
| Talisay / SRP fringe | ₱3.1m | ₱18,000 | 7.0% | 5.4% | ₱5.4m | ₱30,000 | 6.7% | 5.1% | ₱9.5m | ₱52,000 | 6.6% | 5.0% |
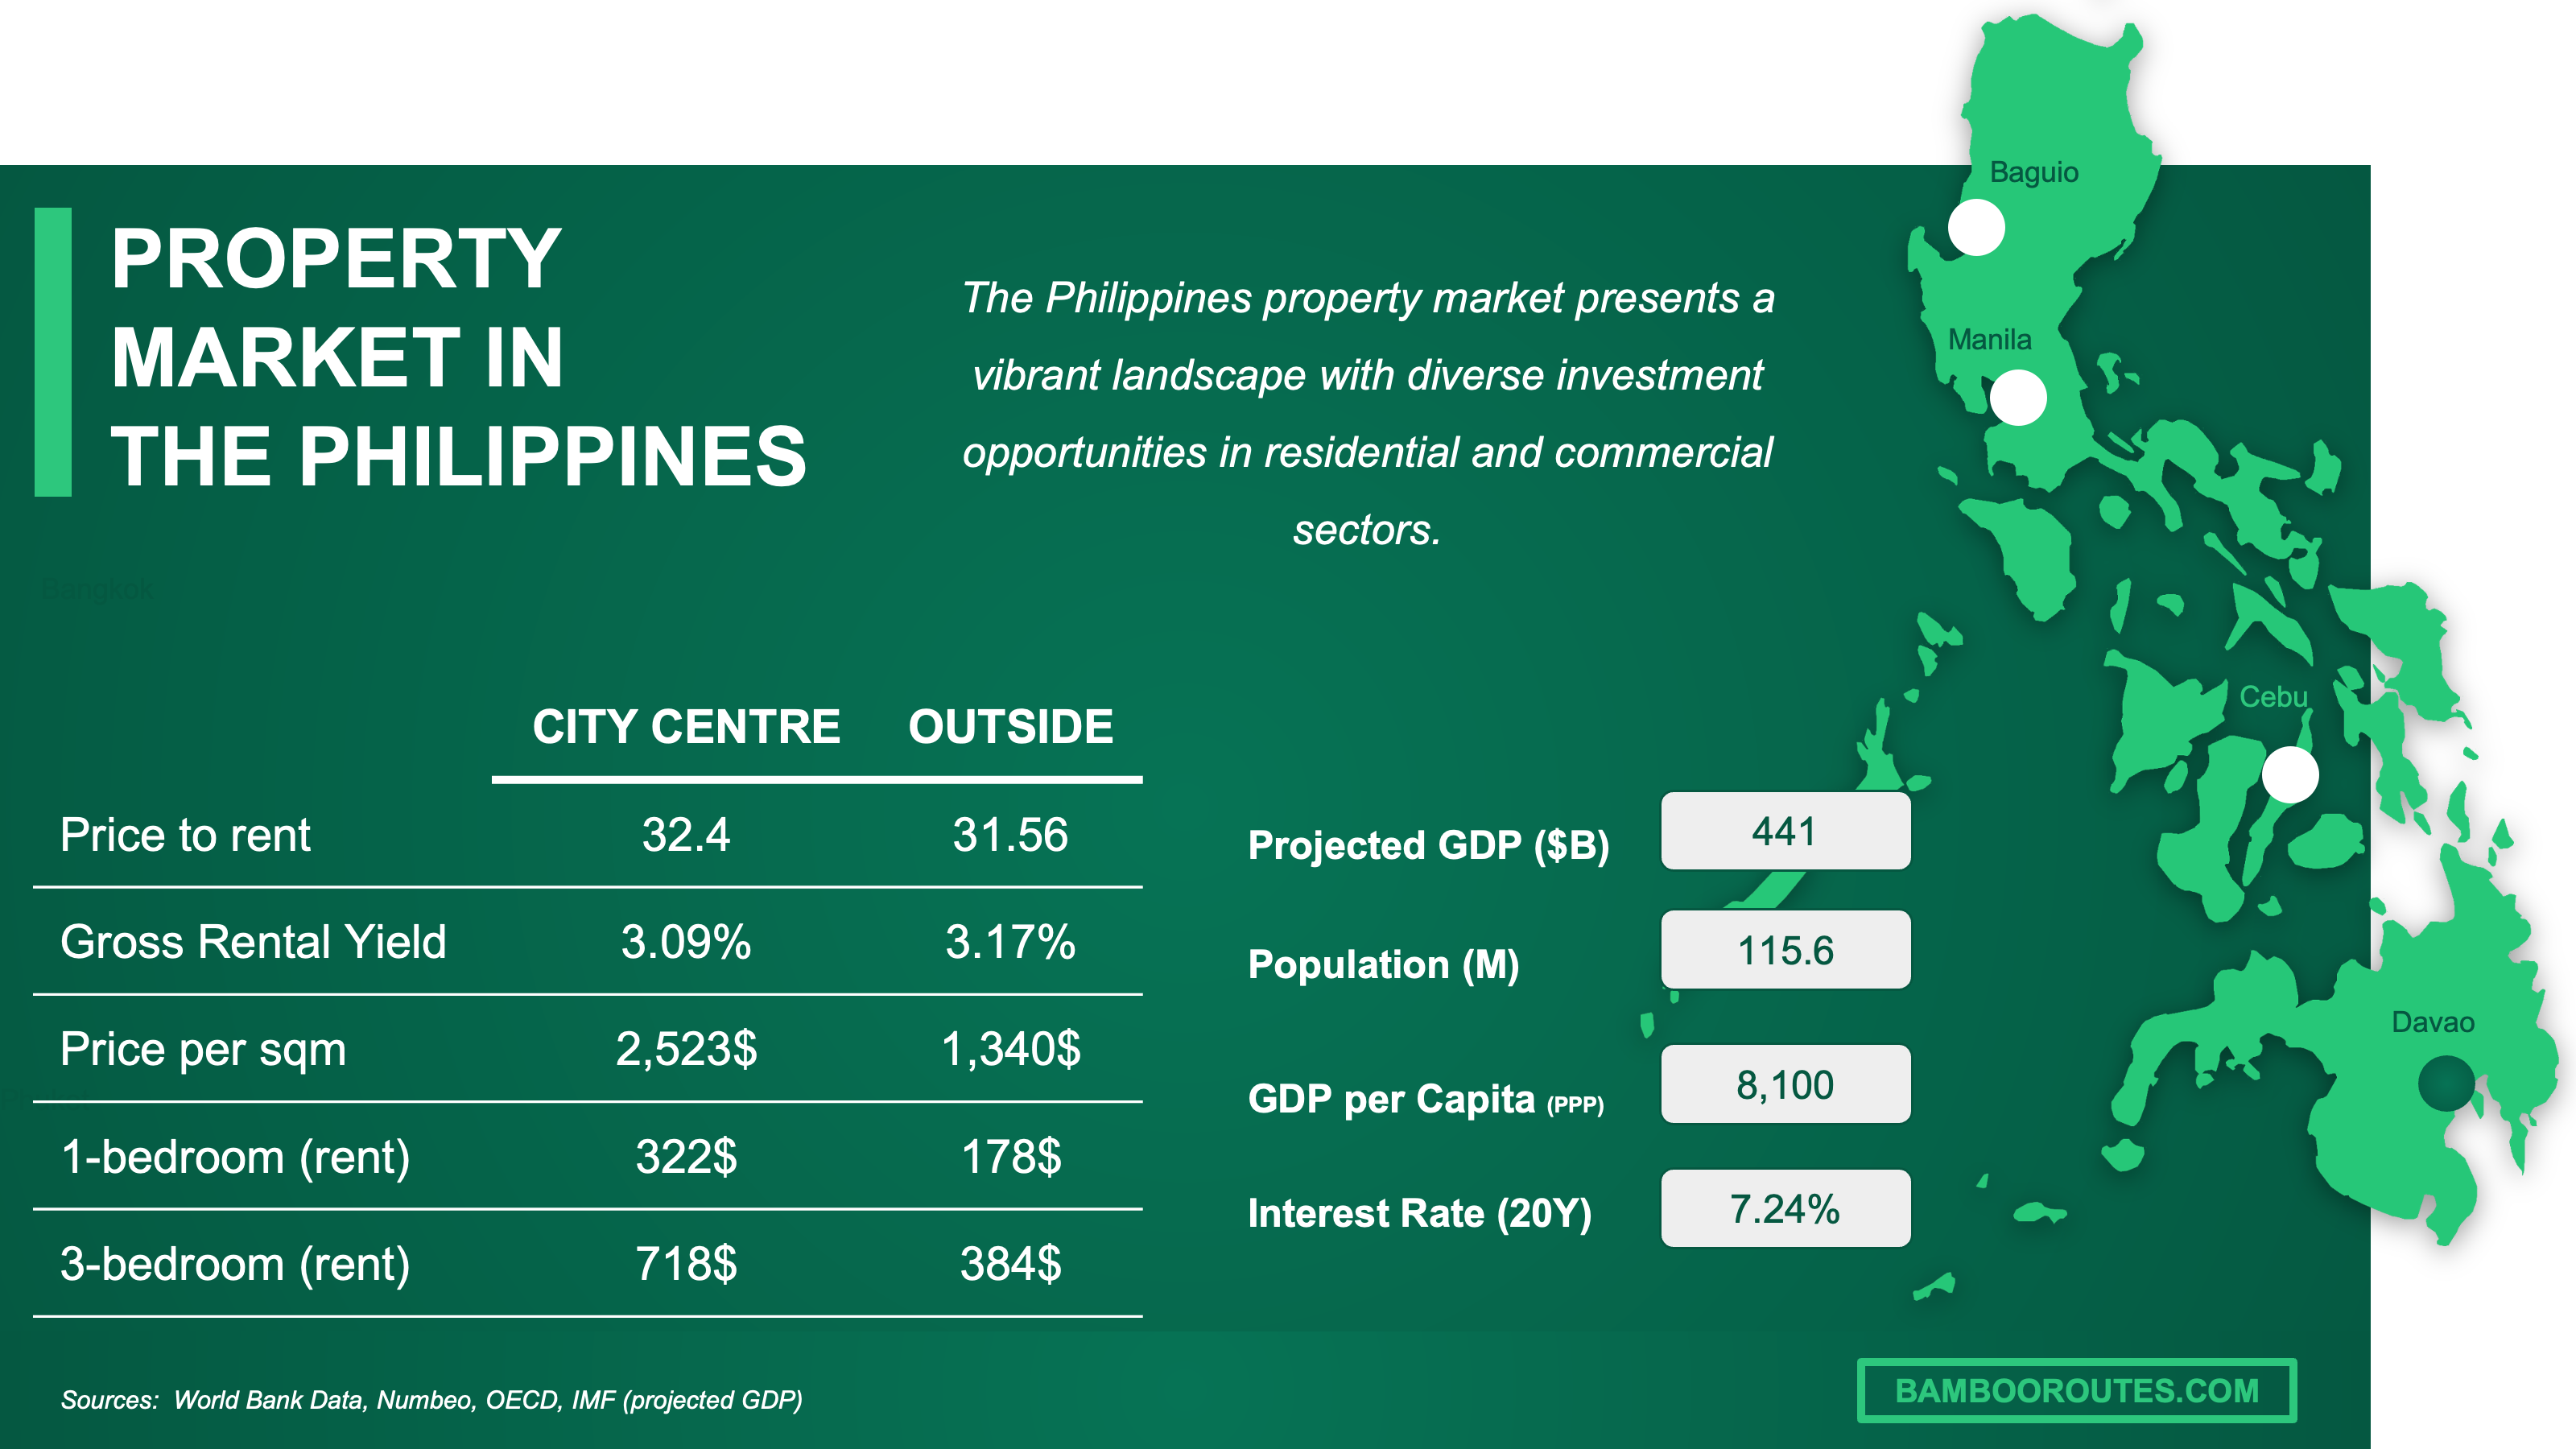
We have made this infographic to give you a quick and clear snapshot of the property market in the Philippines. It highlights key facts like rental prices, yields, and property costs both in city centers and outside, so you can easily compare opportunities. We’ve done some research and also included useful insights about the country’s economy, like GDP, population, and interest rates, to help you understand the bigger picture.
Which neighborhoods offer the best net yield among areas people actually want to live in Cebu?
The best net-yield neighborhoods among livable Cebu apartment areas are Mabolo, Banilad, Mandaue Subangdaku, Fuente Osmeña / Capitol Site, and Talisay / SRP fringe.
These areas matter because the income case is not only based on cheap purchase prices. They also have enough tenant demand to make the rent more credible for a foreign individual buyer.
Mabolo is the cleanest central-yield case in the dataset. A studio is estimated at ₱3.9m with ₱23,000 monthly rent, giving about 7.1% gross yield and 5.4% net yield.
Banilad is slightly less central, but it works for families, professionals, and renters who want access to schools, Oakridge, AS Fortuna, and north Cebu routes. Its studio and 1-bedroom estimates both reach about 5.2% net yield.
Mandaue Subangdaku is the value version of the central Cebu rental story. A studio at about ₱3.4m and ₱20,500 monthly rent gives around 7.2% gross yield and 5.6% net yield.
The practical takeaway is that Cebu Business Park and IT Park are easier to explain to foreign buyers, but Mabolo, Banilad, Fuente Osmeña, and Subangdaku usually give stronger income math.
Where can I find apartments with above-average yields and below-average entry prices in Cebu?
The best Cebu areas for above-average yields and below-average entry prices are Mandaue Subangdaku, Mabolo, Fuente Osmeña / Capitol Site, Ramos / Mango Avenue, and Lapu-Lapu Basak / Marigondon.
The Cebu City gross yield benchmark used in the dataset is about 4.9%, while several neighborhoods in the table show gross yields between 6.5% and 7.4%.
Mandaue Subangdaku is the strongest budget-income compromise. A studio at about ₱3.4m and ₱20,500 monthly rent gives about 7.2% gross yield and 5.6% net yield.
Mabolo costs more than Subangdaku, but it remains central enough to attract renters working near Cebu Business Park, IT Park, hospitals, and the port-side commercial zone. A 1-bedroom apartment is estimated at ₱6.8m and ₱38,000 monthly rent.
Lapu-Lapu Basak / Marigondon has the highest estimated yields in the table. The risk is that the yield is partly a low-price effect, not proof of a deep institutional rental market.
The beginner interpretation is simple. Mabolo and Subangdaku are value opportunities, while Basak / Marigondon is a higher-risk yield play.
Where does the rent level justify the purchase price most clearly in Cebu?
The rent level most clearly justifies the purchase price in Mabolo, Mandaue Subangdaku, Fuente Osmeña / Capitol Site, and Banilad.
These areas have rents strong enough to support their purchase prices without relying only on future appreciation.
Mabolo is a useful example. A 1-bedroom apartment at about ₱6.8m and ₱38,000 monthly rent gives about 6.7% gross yield and 5.0% net yield.
Fuente Osmeña / Capitol Site also looks rational because rents are supported by hospitals, schools, government offices, older commercial corridors, and central transport access. A studio there is estimated at ₱3.3m and ₱19,000 rent, producing about 5.2% net yield.
Cebu Business Park is expensive but not irrational. Tenants pay for Ayala access, walkability, office proximity, and prestige, but the purchase price absorbs much of the rent premium.
The real signal is that the most rational rent-to-price areas are rarely the prettiest. They work because tenants pay for convenience, not luxury branding.
We have actually built the our real estate pack about Cebu to make sure you won’t buy in the wrong area. Check it out.
Make a profitable investment in Cebu
Better information leads to better decisions. Save time and money. Download our data.
Where is the best place to buy if I want stable rental income rather than maximum yield in Cebu?
For stable Cebu rental income, the best neighborhoods are Cebu IT Park / Apas, Cebu Business Park, Banilad, Mabolo, and Mandaue North Reclamation / Mandani Bay.
These areas do not always produce the highest net rental yields in Cebu, but tenant depth is stronger and the addresses are easier to understand.
Cebu IT Park is supported by Cebu’s office and outsourcing economy. In the dataset, a 1-bedroom apartment is estimated at ₱9.8m and ₱48,000 monthly rent, giving about 4.1% net yield.
Cebu Business Park is lower-yielding, but it has the strongest safe-address profile. A 1-bedroom apartment is estimated at only 4.0% net yield, but the renter pool is deeper and resale liquidity is usually better than in cheaper fringe locations.
Banilad is stable for a different reason. It is less dependent on nightlife or tourists and more connected to schools, families, local professionals, and north-side daily life.
The trade-off is return versus predictability. A 5.6% net yield in Subangdaku may look better than 4.0% in Cebu Business Park, but Cebu Business Park is easier to rent and resell in a slow market.
Which apartment type gives the best return for the lowest total investment in Cebu?
For most beginner Cebu investors, the 1-bedroom apartment gives the best return for the lowest practical investment.
Studios can show strong percentage yields, but 1-bedroom apartments usually give better tenant depth and resale flexibility.
Studios are the cheapest way in. In Subangdaku, a studio is about ₱3.4m with 5.6% net yield, while in Mabolo a studio is about ₱3.9m with 5.4% net yield.
But studios can be more tenant-sensitive. They depend heavily on single workers, students, young professionals, and short-stay demand.
A 1-bedroom apartment usually has a wider tenant pool, including singles, couples, expats, hybrid workers, and longer-stay professionals. In Cebu, this matters because many renters want enough space to work from home and stay longer than a short lease.
The trade-off is budget. A 1-bedroom costs more than a studio, but it is often the better first serious rental apartment in Cebu.
We give you more details in the our real estate pack about Cebu.
Which neighborhoods offer strong rental income with the lowest vacancy risk in Cebu?
The Cebu neighborhoods combining strong rental income with lower vacancy risk are Cebu IT Park / Apas, Cebu Business Park, Mabolo, Banilad, and Mactan Newtown / Punta Engaño.
These areas have stronger tenant pools because renters can clearly understand why they would live there.
Cebu IT Park has direct employment demand. A 2-bedroom apartment is estimated at ₱18.8m and ₱90,000 monthly rent, which gives about 5.7% gross yield and 3.9% net yield.
Mabolo is attractive because it sits between major demand zones: Ayala, SM City, Cebu Business Park, hospitals, port-side work areas, and routes toward Mandaue. It is less prestigious than Cebu Business Park, but the rent-to-price math is better.
Mactan Newtown / Punta Engaño can produce high rent, especially for larger apartments. The table estimates a 2-bedroom at ₱19.5m and ₱115,000 monthly rent, giving 7.1% gross yield and 5.1% net yield.
The honest interpretation is that Cebu IT Park and Mabolo have broader year-round tenants, while Mactan can earn more rent but may have more seasonal or lifestyle-driven demand.
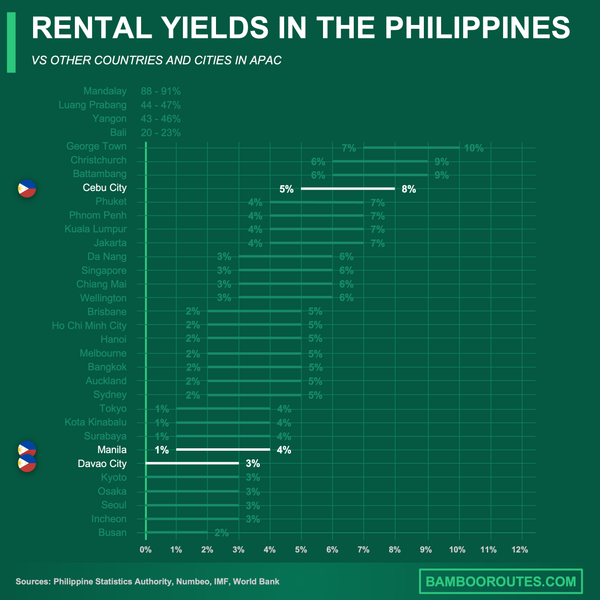
We did some research and made this infographic to help you quickly compare rental yields of the major cities in the Philippines versus those in neighboring countries. It provides a clear view of how this country positions itself as a real estate investment destination, which might interest you if you’re planning to invest there.
Which areas look overpriced relative to their rental income in Cebu?
The Cebu areas that look most expensive relative to rental income are Cebu Business Park, Lahug / Nivel Hills, Cebu IT Park / Apas studios, and some Mandaue North Reclamation / Mandani Bay premium units.
These are not bad places to live. The problem is that purchase prices are high relative to the rent an investor can reasonably collect.
Cebu Business Park is the clearest case. A 2-bedroom apartment at around ₱23.0m and ₱110,000 monthly rent produces about 5.7% gross yield but only 3.7% net yield.
Lahug / Nivel Hills also looks stretched in premium projects. A 1-bedroom apartment at about ₱8.2m and ₱33,000 monthly rent gives only 3.0% net yield.
Cebu IT Park studios show the same warning in a different form. A studio is estimated at ₱5.9m and ₱24,000 rent, producing 4.9% gross yield and only 3.1% net yield.
The trade-off is income return versus lifestyle and capital preservation. These neighborhoods may protect capital better, but they are weaker for rental-income investors.
Which neighborhoods should I avoid even if the rental yield looks attractive in Cebu?
Beginner Cebu investors should be cautious with Lapu-Lapu Basak / Marigondon, Talamban, and some Talisay / SRP fringe apartment choices, even when the headline yield looks attractive.
The problem is not always rent level. The issue is tenant depth, building access, resale liquidity, and how quickly a unit can be rented again after vacancy.
Basak / Marigondon has strong estimated yields, with studios at about 5.8% net yield and 1-bedroom apartments at 5.7% net yield. But the yield is partly a low-price effect.
Talamban also looks affordable, with studio net yield around 5.4%. The risk is that rentability can depend on specific school, family, and local commuter demand.
Talisay / SRP fringe is improving, especially because of SRP-related development, but it is not uniformly liquid. Some projects benefit from road access and malls, while others are still too peripheral for beginner investors.
The practical takeaway is that cheap Cebu apartments can give good spreadsheet yields, but weak access, older buildings, or thin resale demand can erase the advantage.
Which neighborhoods look risky even though the rental yield is high in Cebu?
The riskiest high-yield Cebu areas are Lapu-Lapu Basak / Marigondon, Talamban, and lower-quality Ramos / Mango Avenue buildings.
The risk is not always the rent level. It is tenant depth, building quality, and resale liquidity.
Basak / Marigondon has the strongest table yield, with studios at 7.4% gross yield and 5.8% net yield. The rental market is less institutional and less liquid than central Cebu.
Talamban works for local families, students, and workers who need north-side access. But it is less attractive to many foreign tenants who search first around IT Park, Cebu Business Park, Mabolo, or Mactan lifestyle areas.
Ramos / Mango Avenue can work because it is central, with studios estimated at 5.3% net yield. Older buildings need careful inspection because maintenance, elevators, security, noise, and tenant profile can matter more than the headline yield.
A safer alternative is Mabolo or Mandaue Subangdaku. The yield is still good, but the demand pool is wider.
Get to know the market before buying a property in Cebu
Better information leads to better decisions. Get all the data you need before investing a large amount of money.
What neighborhoods should I avoid when buying a rental apartment in Cebu?
For a beginner rental apartment investor in Cebu, the avoid list is weak buildings in Basak / Marigondon, remote Talamban locations, older poorly managed Ramos / Mango stock, and over-priced premium Lahug units.
This is not a blanket rejection of those neighborhoods. It is a beginner-risk warning.
Basak / Marigondon is mainly a resale and tenant-depth risk. The studio net yield is high at 5.8%, but the rental pool is more location-sensitive than in central Cebu City.
Talamban is a location-access risk. A studio at ₱2.8m and ₱16,000 rent looks efficient, but rentability changes sharply if the unit is far from main roads or daily amenities.
Ramos / Mango is often a building-quality and tenant-profile risk. The area is central, but older stock must be inspected carefully before trusting the yield.
Premium Lahug is a yield risk because rents often do not fully justify the purchase price. A 1-bedroom apartment at ₱8.2m and ₱33,000 rent gives only 3.0% net yield.
Cebu beginners should avoid apartments where the investment case needs too many things to go right. Buy where at least two of rent, vacancy control, resale, and price discipline are already visible.
Which neighborhoods are seeing rental demand weaken, and why, in Cebu?
The Cebu neighborhoods most exposed to weaker rental demand are older Ramos / Mango Avenue buildings, some Talamban locations, and some high-priced premium Lahug apartments.
This looks more like a selective slowdown than a structural collapse. Good units still rent, but weaker buildings need lower rents, better furnishing, or a lower purchase price.
The issue in Ramos / Mango is not centrality. It is building age and tenant competition from newer towers in Mabolo, IT Park, and newer mixed-use districts.
Talamban can weaken when traffic and commute time matter more than rent savings. Renters who work in IT Park, Cebu Business Park, or Mandaue may choose a smaller but more central apartment instead.
Premium Lahug can weaken when purchase prices rise faster than achievable rents. The area remains desirable, but the rent-to-price ratio is less attractive for income investors.
The practical recommendation is to avoid buildings where the rent depends on a best-case tenant. In Cebu, average buildings need average prices, not premium assumptions.
Which neighborhoods are seeing new developments that could create stronger rental demand in Cebu?
The Cebu neighborhoods where new development could strengthen rental demand are Cebu IT Park / Apas, Mandaue North Reclamation / Mandani Bay, Talisay / SRP fringe, Mabolo, and Mactan Newtown / Punta Engaño.
The important distinction is demand-creating development versus supply-heavy development. New offices, transport, retail, and mixed-use nodes can deepen the tenant pool, while too many new apartment towers can create competition.
Cebu IT Park benefits from employment density. The area’s 1-bedroom apartments are estimated at ₱9.8m and ₱48,000 monthly rent, which shows strong rent but a moderate 4.1% net yield because entry prices are high.
Mandaue North Reclamation / Mandani Bay benefits from waterfront mixed-use development, bridge access, and proximity to both Cebu City and Mactan. The risk is that new supply can compete with existing units if demand does not grow at the same speed.
Talisay / SRP fringe benefits from SRP’s retail, road, and mixed-use growth story. Its studio estimate is ₱3.1m with ₱18,000 rent, producing about 5.4% net yield.
Mactan Newtown / Punta Engaño benefits from airport access, resort appeal, and foreign lifestyle demand. The clearest table signal is the 2-bedroom segment, with about 5.1% net yield on ₱115,000 monthly rent.
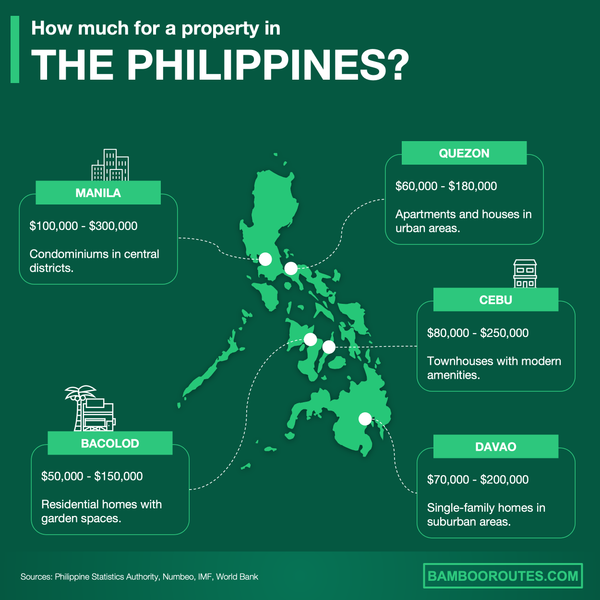
We created this infographic to give you a simple idea of how much it costs to buy property in different parts of the Philippines. As you can see, it breaks down price ranges and property types for popular cities in the country. We hope this makes it easier to explore your options and understand the market.
Which neighborhoods are becoming more attractive to renters because of recent infrastructure or transport changes in Cebu?
The Cebu neighborhoods most helped by recent transport changes are Fuente Osmeña / Capitol Site, Ramos / Mango Avenue, Cebu IT Park / Apas, Mabolo, and Talisay / SRP fringe.
The main infrastructure story in the raw dataset is the Cebu Bus Rapid Transit. The early central corridor makes central mobility more important for apartment demand.
Fuente Osmeña / Capitol Site is the clearest immediate beneficiary because it sits on the early central corridor. A studio there is estimated at ₱3.3m and ₱19,000 rent, producing about 5.2% net yield.
Ramos / Mango may also benefit from better central mobility, but transport does not fix poor building management. A good building and a weak building in the same area can have very different vacancy risk.
Mabolo benefits because it already links several demand zones, including Ayala, SM City, Cebu Business Park, hospitals, the port-side commercial zone, and routes toward Mandaue.
Talisay / SRP fringe is a longer-term transport and road-access story. The yield looks attractive, but tenant demand improvement is less immediate than in central Cebu.
Which neighborhoods have become less attractive for apartment investors over the last 12 months in Cebu?
The Cebu neighborhoods that have become less attractive for rental-income investors are Cebu Business Park, premium Lahug / Nivel Hills, some Cebu IT Park studios, and some waterfront premium Mandaue projects.
The reason is not weak demand. It is price pressure and weaker rent-to-price efficiency.
Cebu Business Park is still excellent for lifestyle and resale, but estimated net yields of 3.7% to 4.8% are weaker than Mabolo, Subangdaku, Banilad, and several value areas.
Premium Lahug has the same problem. Buyers pay for space, greenery, views, and brand quality, but tenants do not always pay enough extra rent to protect yield.
Cebu IT Park studios look less attractive because entry prices are high for the rent level. The studio estimate is ₱5.9m purchase price and ₱24,000 monthly rent, giving only 3.1% net yield.
These areas are still investable at the right price. They are just less attractive if the buyer’s main goal is rental income.
Which apartment types are becoming harder to rent in Cebu, and in which neighborhoods?
The Cebu apartment types becoming harder to rent are overpriced studios in premium business districts, large expensive 2-bedroom apartments outside deep expat or family demand zones, and older unfurnished units in dated central buildings.
Studios are still liquid in Cebu IT Park, Mabolo, and near schools, but they become harder to rent when the building has many identical small units and the rent is too close to a better 1-bedroom apartment.
Large 2-bedroom apartments work best in Cebu Business Park, Banilad, Mactan Newtown, and selected family-oriented or expat-friendly buildings. They are harder in weaker locations because the monthly rent becomes too high for the local tenant pool.
Older unfurnished apartments in Ramos / Mango, lower-grade Lahug, or secondary Mandaue locations need a discount. Tenants increasingly compare security, elevators, internet readiness, furnishing, gym, pool, and walkability.
For a beginner, the safest Cebu apartment type is usually a well-located 1-bedroom apartment. It is more expensive than a studio, but it usually has the broadest tenant market and fewer layout risks.
The practical rule is to buy tenant depth, not only apartment size. A cheap or large unit is not enough if the building cannot attract the right renter quickly.
Don't buy the wrong property, in the wrong area of Cebu
Buying real estate is a significant investment. Don't rely solely on your intuition. Gather the right information to make the best decision.
INSIGHTS
These insights are drawn from the Cebu apartment rental yield dataset, with a focus on what a foreign individual buyer should understand before buying a residential apartment to rent out.
You’ll find even more insights in our our real estate pack about Cebu.
- Cebu studios yield best in cheaper fringe areas, not always in premium towers. A small unit in Basak / Marigondon or Subangdaku can look much stronger on paper than a studio in Cebu IT Park because the purchase price is lower.
- Cebu 1-bedroom apartments look most balanced across price, rent, and liquidity. They usually cost more than studios, but they often attract a wider and more stable tenant base.
- Cebu 2-bedroom apartments work best where families, sharers, or expats deepen demand. Mactan Newtown / Punta Engaño and Cebu Business Park can support high monthly rents, but the buyer must check whether the price still protects net yield.
- Mabolo gives Cebu buyers strong yields without leaving the central rental market. The area is not as polished as Cebu Business Park, but the rent-to-price relationship is more attractive.
- Cebu Business Park is liquid, but its apartment yields are below city value areas. This makes it better for buyers who prioritize address quality and resale over maximum income return.
- Cebu IT Park rents are strong, but entry prices reduce studio yield. The studio estimate of 3.1% net yield is a warning that not every employment district automatically produces strong investor returns.
- Mandaue Subangdaku looks practical for Cebu yield buyers with lower budgets. It has lower entry prices than Cebu Business Park or IT Park while still benefiting from access to Cebu City, Mandaue, bridges, and logistics corridors.
- Mactan Newtown pays high rent, but Cebu investors accept more tourism-season risk. The 2-bedroom rent estimate is high, but demand can be more lifestyle-driven than in the central commuter market.
- Banilad offers Cebu investors family demand without Cebu Business Park pricing. The area works because renters value schools, north-side access, and everyday livability.
- Lahug has lifestyle appeal, but premium buildings weaken rental yield. The 1-bedroom net yield estimate of 3.0% shows how quickly a good address can become inefficient for income buyers.
- Talisay / SRP fringe is improving, but Cebu resale liquidity remains thinner. The yield looks attractive, but buyers should avoid paying full future value before tenant demand is visible.
- Basak / Marigondon has high Cebu yields, but location risk is higher. The table numbers are strong, but resale depth and rental speed are more block-by-block than in Cebu City.
- Kasambagan is a Cebu middle-ground: central enough, cheaper than IT Park. It can work when the building is well managed and priced below the top business district premium.
- Ramos / Mango yields are decent, but building age and tenant mix matter more. A central address does not protect the investor if elevators, security, maintenance, and noise are weak.
- Cebu buyers should compare net yield, not headline rent, before choosing. Gross rent can look impressive, but vacancy, maintenance, association dues, letting costs, and management can change the real return.
Don't lose money on your property in Cebu
100% of people who have lost money there have spent less than 1 hour researching the market. We have reviewed everything there is to know. Grab our guide now.

OUR METHODOLOGY TO BUILD THIS TRACKER
To estimate purchase price, monthly rent, and rental yield in different Cebu neighborhoods, we built the dataset manually from the ground up. We did not reuse a third-party yield dataset.
For each Cebu neighborhood and apartment type in the tracker, we manually researched current residential sale and rental listings across major real estate platforms relevant to Cebu, including Lamudi, Dot Property Philippines, and Rentpad.
First, we collect sale listings for each neighborhood and property type. We then clean the sale sample and keep only reasonably comparable residential apartments based on location, apartment type, size, condition, building quality, and listing quality.
Duplicate listings, unrealistic asking prices, luxury outliers, distressed assets, serviced-style offers, incomplete listings, and clearly non-comparable properties are removed. We use the median purchase price as the main reference where possible, and the average only when the sample is clean.
We build the rental side of the dataset separately. For the same neighborhood and apartment type, we manually collect rental listings, remove outliers and non-comparable listings, and estimate a realistic monthly rent using the median rent where possible.
Purchase prices and rents are researched separately, then matched by neighborhood and apartment type to estimate gross rental yield. Gross rental yield is calculated as annual rent divided by estimated purchase price.
Net rental yield is then estimated by adjusting for the costs and risks that matter for each neighborhood and apartment type. These include vacancy risk, maintenance, management costs, agent fees, tax friction, repairs, utilities, association dues, service charges, building costs, and other operating costs where relevant.
We do not apply one flat discount to every apartment. A small central apartment, a premium tower unit, a tourism-linked Mactan apartment, and a lower-price fringe apartment do not have the same operating cost profile.
Each estimate is assigned a confidence level based on the quality and size of the comparable listing sample. A sample of 30 to 40 comparable listings means higher confidence. A sample of 20 to 30 comparable listings means usable but less robust. Fewer than 20 comparable listings means directional only unless the comparable area is widened.
These estimates are updated regularly and should be read as structured market estimates, not as guarantees of future rental income. Honesty, quality, and rigor are central to our work, and they are also what you will find in our real estate pack about Cebu.

Related blog posts