Authored by the expert who managed and guided the team behind the Philippines Property Pack

Get all the data you need about the real estate market in Cebu
We constantly update this blog post so Cebu rent figures stay useful for buyers, landlords and investors in 2026.
In Cebu in 2026, long-term residential rents are still driven by jobs, schools, transport, building quality and furniture.
The strongest rental areas in Cebu are still IT Park, Cebu Business Park, Lahug, Banilad, Mabolo, Mactan Newtown and selected Mandaue nodes.
And if you’re planning to buy a property in this place, you may want to download our pack covering the real estate market in Cebu.

What are typical rents in Cebu as of 2026?
What's the average monthly rent for a studio in Cebu as of 2026?
As of 2026, the average monthly rent for a good studio in Cebu is about ₱23,000, which is roughly $410 or €350.
Most studios in Cebu in 2026 rent from about ₱12,000 to ₱35,000 per month, or roughly $210 to $620 and €180 to €535.
The biggest reasons studio rents vary in Cebu are location, furniture, building age, walkability to IT Park or Cebu Business Park, and whether the unit feels easy for a tenant to move into.
What's the average monthly rent for a 1-bedroom in Cebu as of 2026?
As of 2026, the average monthly rent for a normal furnished 1-bedroom apartment in Cebu is about ₱36,000, which is roughly $640 or €550.
Most 1-bedroom apartments in Cebu in 2026 rent from about ₱22,000 to ₱75,000 per month, or roughly $390 to $1,330 and €335 to €1,145.
Cheaper 1-bedroom rents are more common in older downtown Cebu, parts of Mandaue and parts of Lapu-Lapu, while the highest rents are usually in IT Park, Cebu Business Park, Lahug, Mandani Bay and Mactan Newtown.
What's the average monthly rent for a 2-bedroom in Cebu as of 2026?
As of 2026, the average monthly rent for a good 2-bedroom apartment in Cebu is about ₱62,000, which is roughly $1,100 or €950.
Most 2-bedroom apartments in Cebu in 2026 rent from about ₱35,000 to ₱130,000 per month, or roughly $620 to $2,300 and €535 to €1,985.
Cheaper 2-bedroom rents are usually found in older Cebu City, Mandaue and Lapu-Lapu stock, while the most expensive 2-bedroom rents are in Cebu Business Park, Lahug, Banilad, Mandani Bay and sea-facing parts of Mactan.
By the way, you will find much more detailed rent ranges in our property pack covering the real estate market in Cebu.
What's the average rent per square meter in Cebu as of 2026?
As of 2026, the average rent per square meter for a good long-term condo in Cebu is about ₱850 per sqm per month, or roughly $15 and €13.
The realistic rent per square meter range in Cebu in 2026 is about ₱500 to ₱1,300 per sqm per month, or roughly $9 to $23 and €8 to €20.
Cebu rent per square meter is usually below the most expensive parts of Metro Manila, but it can be high in small furnished units near IT Park, Cebu Business Park and Mactan Newtown.
In Cebu, rent per square meter rises above average when a unit is furnished, walkable to offices, inside a newer tower, close to malls, or easy for BPO workers, expats and students to occupy quickly.
How much have rents changed year-over-year in Cebu in 2026?
As of 2026, average residential rents in Cebu are about 6% higher than one year earlier, with prime furnished studios and 1-bedrooms rising faster.
The main reasons Cebu rents increased in 2026 are BPO demand, student demand, returning workers, inflation, stronger Mactan activity and better visibility around the Cebu BRT corridor.
This rent growth looks stronger than the softer parts of 2025, but it is still not a runaway market because new condo supply keeps many Cebu landlords price-sensitive.
What's the outlook for rent growth in Cebu in 2026?
As of 2026, Cebu rents are likely to rise another 2% to 5% during the rest of the year, with the best furnished units closer to the upper end.
The key support for Cebu rent growth is the mix of BPO jobs, universities, hospitals, tourism, Mactan airport access, and transport-linked demand around IT Park, Fuente, Osmeña Boulevard and SRP.
The neighborhoods expected to see the strongest Cebu rent growth are IT Park, Lahug, Cebu Business Park, Mabolo, Banilad, Mandani Bay and Mactan Newtown.
The main risks are affordability pressure, too many similar small condos, weak furnishing, slow turnover in older buildings and any delay in infrastructure benefits becoming visible to tenants.
Get fresh and reliable information about the market in Cebu
Don't base significant investment decisions on outdated data. Get updated and accurate information.

Which neighborhoods rent best in Cebu as of 2026?
Which neighborhoods have the highest rents in Cebu as of 2026?
As of 2026, the highest-rent Cebu neighborhoods are Cebu IT Park, Cebu Business Park and Mactan Newtown, where good units often rent from ₱35,000 to ₱90,000 per month, or about $620 to $1,595 and €535 to €1,375.
These Cebu neighborhoods command premium rents because they offer offices, malls, restaurants, safer buildings, shorter commutes, better condo amenities and a clearer lifestyle for tenants.
The usual tenants in these high-rent Cebu areas are BPO managers, foreign professionals, digital workers, expats, young couples and company-supported tenants.
By the way, we’ve written a blog article detailing Sources and methodology: we compared prime-area listings on Rentpad, Lamudi and OnePropertee. We weighted walkable office districts more heavily than isolated expensive listings. We also checked our own Cebu neighborhood rent map.
Where do young professionals prefer to rent in Cebu right now?
Young professionals in Cebu usually prefer Cebu IT Park, Lahug and Mabolo because these areas keep daily life simple and close to work.
In these Cebu neighborhoods, young professionals typically pay about ₱20,000 to ₱45,000 per month, or roughly $355 to $795 and €305 to €690.
The lifestyle features that attract young professionals in Cebu are walkable food options, BPO offices, nightlife, gyms, 24-hour services, fiber internet and shorter rides home after late shifts.
By the way, you will find a detailed tenant analysis in our property pack covering the real estate market in Cebu.
Where do families prefer to rent in Cebu right now?
Families in Cebu usually prefer Banilad, Talamban and Lahug because these areas offer larger homes, schools, quieter streets and better access to daily family needs.
Families renting 2-bedroom or 3-bedroom homes in these Cebu neighborhoods usually pay about ₱45,000 to ₱120,000 per month, or roughly $795 to $2,125 and €690 to €1,830.
These Cebu neighborhoods attract families because they offer parking, schools, clinics, supermarkets, gated communities, larger layouts and easier access to the north-side professional corridor.
Important education options near these family-friendly Cebu areas include University of San Carlos Talamban Campus, Cebu International School, Ateneo de Cebu, University of the Philippines Cebu and schools around Banilad and Talamban.
Which areas near transit or universities rent faster in Cebu in 2026?
As of 2026, the fastest-renting Cebu areas near transit or universities are IT Park and Apas, Fuente Osmeña and Capitol Site, and Talamban near USC.
In these high-demand Cebu areas, well-priced rentals often stay listed for only 15 to 35 days before finding a tenant.
In Cebu, a walkable location near major offices, BRT corridors or universities can add about ₱3,000 to ₱10,000 per month, or roughly $55 to $175 and €45 to €155, compared with a similar but less convenient unit.
Which neighborhoods are most popular with expats in Cebu right now?
The Cebu neighborhoods most popular with expats are Lahug and IT Park, Cebu Business Park, and Mactan Newtown or Punta Engaño.
Expats in these Cebu neighborhoods typically pay about ₱35,000 to ₱100,000 per month, or roughly $620 to $1,770 and €535 to €1,525.
These Cebu areas attract expats because they offer furnished condos, safer buildings, malls, restaurants, airport access, beach access in Mactan, and an easier daily routine in English.
The most visible expat communities in Cebu include Americans, Koreans, Japanese, Europeans, Australians and foreign professionals connected to business services, education, retirement and tourism.
And if you are also an expat, you may want to read our Sources and methodology: we used Lamudi, Rentpad and OnePropertee for expat-style condo evidence. We matched listings with airport, mall, business and lifestyle access. We also used our own expat-renter filters for Cebu.
Get to know the market before buying a property in Cebu
Better information leads to better decisions. Get all the data you need before investing a large amount of money.
Who rents, and what do tenants want in Cebu right now?
What tenant profiles dominate rentals in Cebu?
The top three tenant profiles in Cebu are BPO and IT workers, students and young professionals, and families or expats looking for larger or better-located homes.
A practical 2026 estimate is that BPO and IT workers represent about 35% of investor-relevant condo demand in Cebu, students and young professionals about 25%, and families and expats about 25%.
In Cebu, BPO and IT workers usually want furnished studios or 1-bedrooms, students want affordable studios or shared units, while families and expats usually want 2-bedroom units, houses or larger condos.
If you want to optimize your cashflow, you can read our Sources and methodology: we used PSA population data, Colliers Cebu research and University of San Carlos. We compared those demand anchors with listings from Rentpad, Lamudi and OnePropertee. We also used our own Cebu tenant segmentation.
Do tenants prefer furnished or unfurnished in Cebu?
In Cebu condo rentals in 2026, about 70% of investor-relevant tenants prefer furnished units, while about 30% are comfortable with semi-furnished or unfurnished homes.
A furnished apartment in Cebu often earns about ₱3,000 to ₱12,000 more per month, or roughly $55 to $210 and €45 to €185, than a similar unfurnished apartment.
Furnished rentals in Cebu are especially popular with BPO workers, medical staff, students, foreign professionals, digital workers, relocating Filipinos and expats who want a simple move-in.
Which amenities increase rent the most in Cebu?
The five amenities that increase rent the most in Cebu are a parking slot, fast fiber internet, inverter air-conditioning, backup power or reliable building systems, and a balcony or good view.
In Cebu, parking can add ₱5,000 to ₱15,000 per month, fast internet ₱1,500 to ₱4,000, inverter air-conditioning ₱1,500 to ₱4,000, reliable backup systems ₱2,000 to ₱6,000, and a balcony or view ₱2,000 to ₱8,000.
In our property pack covering the real estate market in Cebu, we cover what are the best investments a landlord can make.
What renovations get the best ROI for rentals in Cebu?
The five best ROI renovations for Cebu rentals are inverter split-type AC, fiber internet setup, fresh paint and lighting, better basic furniture, and a washer or laundry-ready setup.
In Cebu, these upgrades often cost about ₱120,000 to ₱250,000 in total, or roughly $2,125 to $4,425 and €1,830 to €3,815, and can lift monthly rent by about ₱3,000 to ₱8,000.
Poor ROI renovations in Cebu usually include overly fancy design finishes, expensive custom furniture, luxury appliances that tenants will not pay for, and renovations that ignore humidity, leaks, pest control or air-conditioning quality.
Make a profitable investment in Cebu
Better information leads to better decisions. Save time and money. Download our data.
How strong is rental demand in Cebu as of 2026?
What's the vacancy rate for rentals in Cebu as of 2026?
As of 2026, the estimated vacancy rate for normal residential rentals in Cebu is about 7% to 10%.
In Cebu, prime furnished units in IT Park and Cebu Business Park can sit closer to 4% to 7% vacancy, while older or poorly located units can reach 10% to 15%.
Compared with the historical Cebu average, vacancy in 2026 looks normal to slightly tight for the best furnished units, but still selective for generic condos in weaker buildings.
Finally please note that you will have all the indicators you need in our property pack covering the real estate market in Cebu.
How many days do rentals stay listed in Cebu as of 2026?
As of 2026, the average Cebu rental stays listed for about 45 to 60 days before finding a tenant.
Prime furnished studios and 1-bedrooms in Cebu often lease in 15 to 30 days, good standard condos in 30 to 45 days, and overpriced or poorly located units can take 90 days or more.
Compared with one year ago, days on market in Cebu are a little shorter for good furnished units, but not much better for older units that compete with newer condo supply.
Which months have peak tenant demand in Cebu?
The strongest tenant demand months in Cebu are usually January to March, May to August, and October to early December.
These Cebu rental peaks come from job moves, BPO hiring, school-year moves, university activity, expat returns, company assignments and families planning around school calendars.
The slower months in Cebu are usually Holy Week, late December for contract signing, and some storm-heavy periods when tenants become more cautious about leaks, flooding and backup power.
Don't buy the wrong property, in the wrong area of Cebu
Buying real estate is a significant investment. Don't rely solely on your intuition. Gather the right information to make the best decision.
What will my monthly costs be in Cebu as of 2026?
What property taxes should landlords expect in Cebu as of 2026?
As of 2026, many Cebu condo landlords should expect about ₱12,000 to ₱30,000 per year in real property tax, or roughly $210 to $530 and €180 to €460.
The realistic annual property tax range in Cebu can run from below ₱10,000 to above ₱60,000, or roughly below $175 to above $1,060 and below €155 to above €915, depending on the tax declaration and property value.
Property taxes in Cebu are calculated from the assessed value shown in the tax declaration, then multiplied by the local real property tax rate and the Special Education Fund charge.
Please note that, in our property pack covering the real estate market in Cebu, we cover what exemptions or deductions may be available to reduce property taxes for landlords.
What utilities do landlords often pay in Cebu right now?
In Cebu, landlords most often pay condo dues, real property tax, major repairs, building insurance where applicable, and sometimes internet or water if the lease is semi-serviced.
Typical landlord-paid monthly costs in Cebu can be ₱3,000 to ₱8,000 for condo dues, ₱1,000 to ₱2,500 for property tax reserve, ₱2,000 to ₱6,000 for repairs and maintenance reserve, and ₱1,500 to ₱3,000 for internet if included.
The common Cebu practice is that tenants pay electricity, water and internet, while landlords pay ownership costs, association dues, major repairs and appliance replacement from normal wear.
How is rental income taxed in Cebu as of 2026?
As of 2026, rental income in Cebu is taxable in the Philippines, and individual landlords usually need to plan for income tax, possible withholding tax, and possible VAT issues if receipts are high enough.
Common deductions or cost items for Cebu landlords can include repairs, condo dues, real property tax, depreciation, insurance, broker fees and other documented expenses linked to the rental property.
Common Cebu tax mistakes include confusing BIR zonal values with real market rent, ignoring withholding tax when a company rents the unit, and forgetting that Cebu City real property tax is separate from national income tax.
We cover these mistakes, among others, in our Sources and methodology: we used BIR withholding tax guidance, BIR zonal values and Cebu City Government. We simplified the tax explanation for small individual landlords. We also used our own Philippines rental-tax checklist for Cebu property owners.
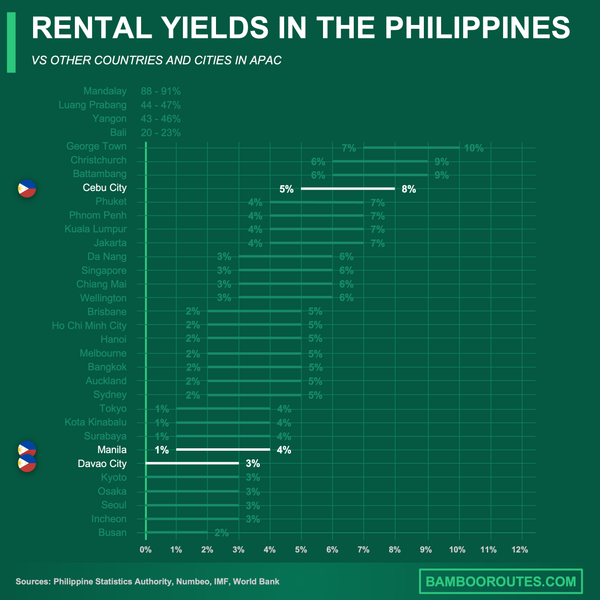
We did some research and made this infographic to help you quickly compare rental yields of the major cities in the Philippines versus those in neighboring countries. It provides a clear view of how this country positions itself as a real estate investment destination, which might interest you if you’re planning to invest there.
What sources have we used to write this blog article?
Whether it’s in our blog articles or the market analyses included in our property pack about Cebu, we always rely on the strongest methodology we can … and we don’t throw out numbers at random.
We also aim to be fully transparent, so below we’ve listed the authoritative sources we used, and explained how we used them and the methods behind our estimates.
| Source | Why this source matters | How we used it |
|---|---|---|
| Philippine Statistics Authority, 2020 Census | PSA is the official statistics agency of the Philippines. | We used this source to anchor Cebu’s population base and household demand. We treated it as demographic context, not as direct rent evidence. |
| PSA Central Visayas CPI and inflation | PSA Region VII is the official regional statistics office for Central Visayas. | We used this source to understand 2026 cost pressure in Cebu. We compared rent-growth estimates with regional inflation instead of trusting listing prices alone. |
| Bangko Sentral ng Pilipinas RPPI | BSP is the central bank and publishes the official residential property price index. | We used this source to understand the national housing-price cycle. We did not treat it as a Cebu rent index because it tracks property prices, not local rents. |
| BIR withholding tax portal | BIR is the official tax authority in the Philippines. | We used this source to frame rental-income tax and withholding-tax exposure. We simplified the explanation for individual landlords and reminded readers to check their own position. |
| BIR zonal values | BIR zonal values are official tax-reference values for real property. | We used this source to explain why tax values and market rents are different. We used it for tax context, not for estimating Cebu rents. |
| Cebu City Government | This is the official Cebu City government website. | We used this source for Cebu City administrative and tax context. We reminded readers that local tax declarations matter more than simple market-price shortcuts. |
| Cebu City Real Property Tax Online Payment System | This is Cebu City’s official real-property tax payment and help system. | We used this source to confirm that owners deal with local assessment and payment through the city system. We converted property tax into a monthly landlord budgeting item. |
| Colliers Philippine Property Market Outlook 2026 | Colliers is a major real estate consultancy with established Philippine market research. | We used this source for the 2026 national property-cycle backdrop. We cross-checked whether Cebu rent growth should be moderate or aggressive. |
| Colliers Cebu Residential Sector Report | Colliers has dedicated Cebu residential research and supply tracking. | We used this source to understand Cebu condo supply pressure. We used that supply context to avoid overstating future rent growth. |
| Rentpad Cebu long-term rentals | Rentpad is a major Philippine rental listing platform with visible rents and unit details. | We used this source to estimate asking rents for studios, 1-bedroom and 2-bedroom units. We discounted luxury and unusual listings before building average ranges. |
| Lamudi Cebu rentals | Lamudi is one of the Philippines’ major property portals. | We used this source as a second listing check for Cebu rents and locations. We excluded office and serviced-office listings from residential estimates. |
| OnePropertee Cebu City condo rentals | OnePropertee provides current Cebu City listing counts and price ranges. | We used this source to cross-check Cebu City condo supply and broad asking-rent ranges. We treated the data as asking-price evidence, not signed lease evidence. |
| OnePropertee 2-bedroom Cebu City condo rentals | This page gives bedroom-specific Cebu City listing evidence. | We used this source to estimate the 2-bedroom rent range. We adjusted down from luxury outliers to get a more realistic average for individual landlords. |
| World Bank Cebu BRT project documentation | The World Bank is a project financier and publishes official project documents. | We used this source to understand why Cebu transit corridors matter for rental liquidity. We treated BRT access as a demand and leasing-speed factor, not a rent dataset. |
| Philstar Cebu BRT 2026 partial operations report | This report gives 2026 context on the start of partial Cebu BRT operations. | We used this source to identify transit-linked demand around IT Park, SRP and Osmeña Boulevard. We treated it as infrastructure context, not direct rent evidence. |
| University of San Carlos | USC is one of Cebu’s major universities and an official institutional source. | We used this source to locate student-linked rental demand around Talamban, Downtown and Lahug. We combined it with Cebu neighborhood geography rather than using it as rent data. |
Get fresh and reliable information about the market in Cebu
Don't base significant investment decisions on outdated data. Get updated and accurate information.
Related blog posts